Project Principle
The key principles underlying project design are:
- A decentralized mechanism where the main tank beneficiaries play a proactive role in planning, implementing and sustaining project interventions.
- The tank system rehabilitation work meets technical quality safety standards and pays adequate attention to social, environment and fiduciary considerations.
- To improve agricultural productivity and farmer income, access to improved agricultural technologies and practices and facilitation of market linkage for agricultural producers are as important as improving access to water.
Objectives
The project aimed at achieving sustainability of restored minor irrigation systems through community participation and empowerment to develop self-owned, self-managed and self-sustenance of Pani Panchayats. It aspires to create and enabling legal and institutional environment to implement the solutions emerging out of participatory and demand driven processes. It further intends to usher in sustainable improvement of tank based agriculture livelihood system by increasing production, productivity and profitability of agriculture, horticulture, fisheries and livestock production system.
Project Component
The project objectives have been encompassing four main project components as described below:
- Institutional Strengthening: This includes inter alia, strengthening of community-based institutions to assume responsibility for the tank system improvement and management, development of human resources and developing mechanisms where by the needs of the traditionally vulnerable stakeholders can be addressed.
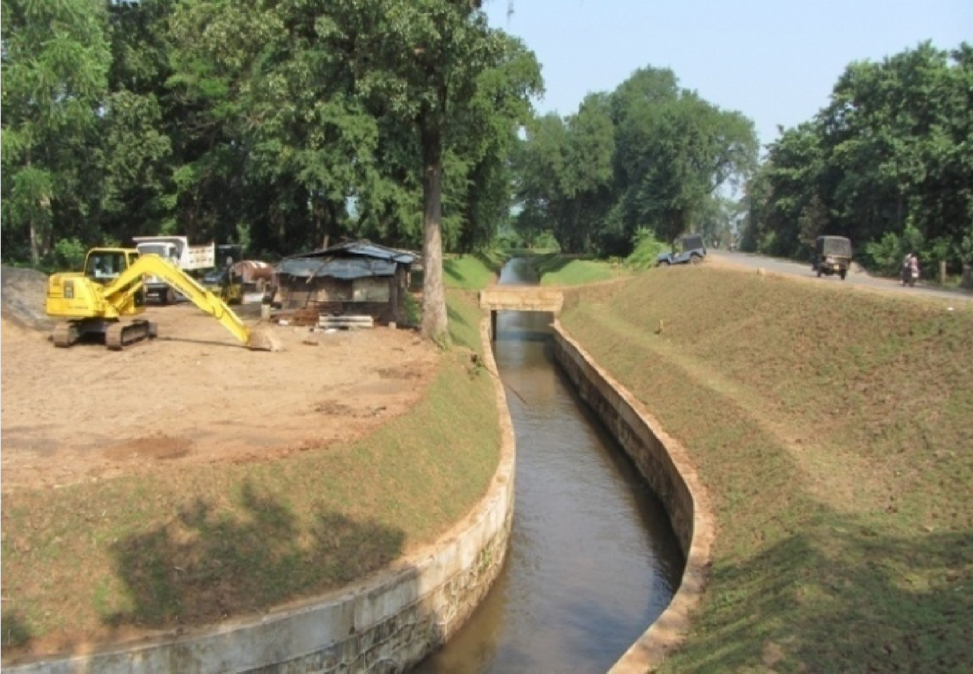
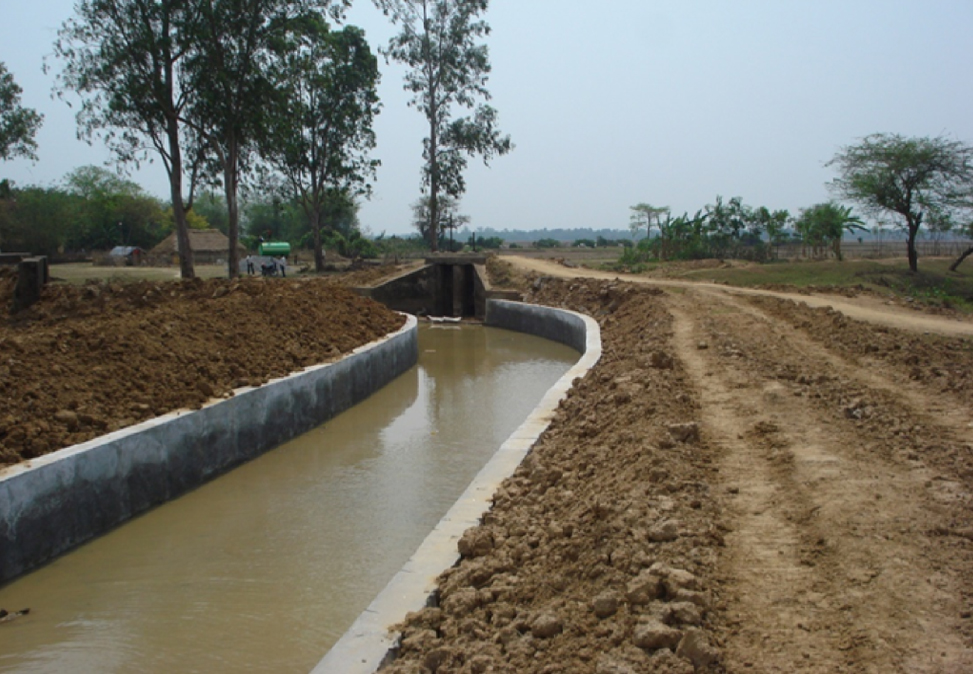
- Tank System Improvement: This includes physical improvement of the tank systems. The actual rehabilitation work required would be determined for each tank system individually with an upfront "Tank Improvement and Management Plan (TIMP)" prepared in consultation with tank users prior to undertaking any investments. In general, interventions are likely to address deficiencies in feeder channels, tank bed and structures, and the water distribution and drainage systems.
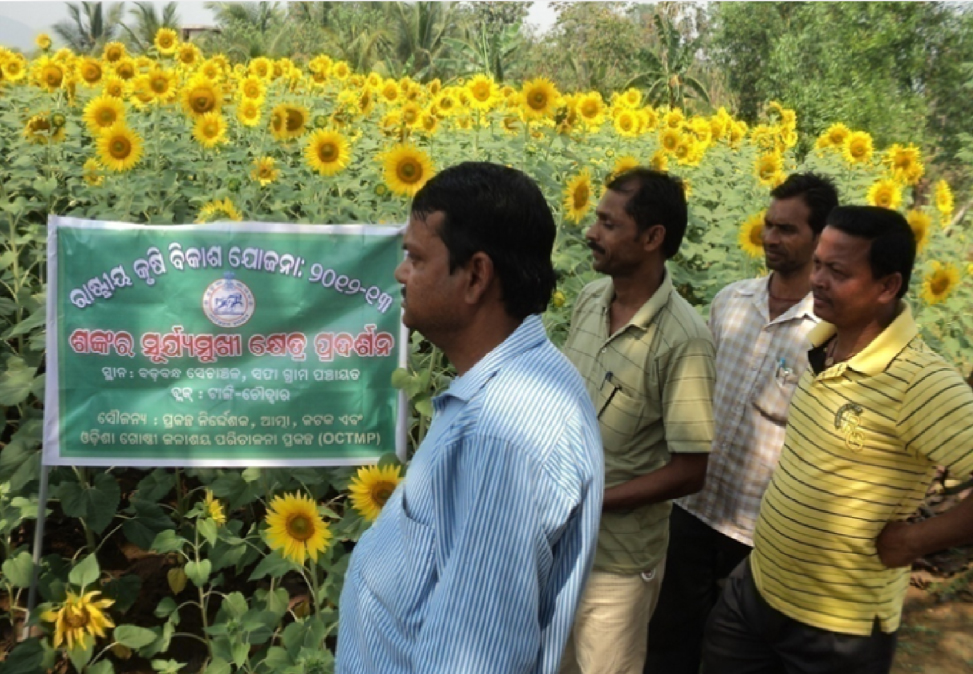
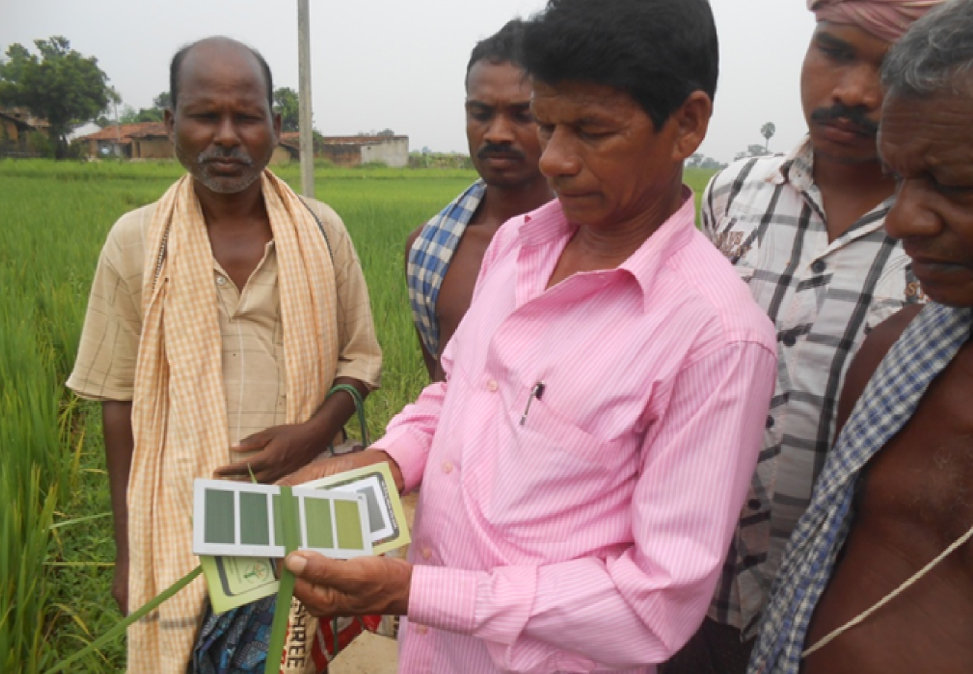
- Agricultural and Livelihood Support Services (ALSS): This includes Agriculture, Horticulture, Livestock, Fisheries and Agri-marketing sub-components of the project. The objective is to support the stakeholders of the respective Minor Irrigation projects to increase production & productivity of selected agricultural produce through improved production technique and increase the share of final value obtained by farmer marketing groups in targeted commodities.
- Project Management: The objective of this component is to ensure smooth implementation of project activities. The different sub-components include Finance & Procurement, documentation & communication and monitoring & Evaluation of the key activities.
Project Profile
| Total MIPs: |
332 Nos. |
| CCA covered: |
64,200 ha. (approx.) |
| Project Area: |
12 Districts of Odisha |
| Original Project Cost: |
US $ 87.80 million
(INR 375 Cr. approx.) |
| Revised Project Cost: |
US $ 76.39 million
(INR 432 Cr. approx.) |
| Project Agreement signed: |
27.01.2009 |
| Project Closing date (Original): |
31.08.2014 |
| Project Closing date (Revised): |
30.06.2016 |
Physical Status
By the end of March' 2017, renovation & improvement works of 332 Minor Irrigation tanks covering CCA of 64,237 hectares were completed. A District-wise status of rehabilitation of the tanks and other related activities are shown in Table-3.1. The financial status are shown in Table-3.2.
Table – 3.1
Year wise Status of OCTMP projects Completed |
Sl. No. |
Name of the District |
No of projects completed Year-wise |
Irrigation Potential revived in Ha. |
Total |
2014-15 |
2015-16 |
2016-17 |
2014-15 |
2015-16 |
2016-17 |
Nos. |
Potential revived in Ha. |
1 |
2 |
3 |
4 |
5 |
6 |
7 |
8 |
9 |
10 |
| Non-KBK Districts |
1 |
Angul |
7 |
29 |
14 |
1,249 |
6,763 |
4,959 |
50 |
12,971 |
2 |
Balasore |
15 |
6 |
6 |
1,479 |
2,456 |
1,977 |
27 |
5,912 |
3 |
Baragarh |
10 |
6 |
3 |
863 |
262 |
554 |
19 |
1,679 |
4 |
Boudh |
11 |
8 |
5 |
3,433 |
2,390 |
2,666 |
24 |
8,489 |
5 |
Cuttack |
20 |
14 |
2 |
2,274 |
3,867 |
200 |
36 |
6,341 |
6 |
Gajapati |
3 |
3 |
9 |
293 |
198 |
913 |
15 |
1,404 |
7 |
Ganjam |
7 |
1 |
6 |
534 |
1,032 |
3,813 |
14 |
5,379 |
8 |
Jajpur |
7 |
1 |
2 |
379 |
121 |
167 |
10 |
667 |
9 |
Jharsuguda |
5 |
7 |
4 |
542 |
2,415 |
355 |
16 |
3,312 |
10 |
Khurda |
26 |
40 |
26 |
2,714 |
3,343 |
5,900 |
92 |
11,957 |
11 |
Mayurbhanja |
7 |
1 |
2 |
1,219 |
1,040 |
280 |
10 |
2,539 |
|
TOTAL |
118 |
116 |
79 |
14,979 |
23,887 |
21,784 |
313 |
60,650 |
KBK District |
|
|
|
|
|
|
|
|
1 |
Rayagada |
14 |
2 |
3 |
2,743 |
534 |
310 |
19 |
3,587 |
|
TOTAL |
14 |
2 |
3 |
2,743 |
534 |
310 |
19 |
3,587 |
|
G.TOTAL |
132 |
118 |
82 |
17,722 |
24,421 |
22,094 |
332 |
64,237 |
Table - 3.2
Financial Status of OCTMP up to March' 2017
Sl. No. |
Project Components |
Revised Cost
(in Lakh INR) |
Expenditure During
2015-16 |
Cumulative Expenditure by 3/2017 (in Lakh INR) |
Expenditure |
% of Expenditure |
1 |
Institutional Strengthening |
2,132.66 |
295.99 |
1,650.45 |
77.39 |
2 |
Tank System Improvement |
32,647.34 |
8,533.52 |
30,756.28 |
94.21 |
3 |
Agriculture Livelihood Support System |
4,860.35 |
1,160.16 |
4,071.44 |
83.77 |
|
3.1 |
Agriculture |
1,318.00 |
472.82 |
1,225.57 |
92.99 |
|
3.2 |
Horticulture |
477.00 |
125.14 |
351.27 |
73.64 |
|
3.3 |
Livestock |
732.00 |
211.72 |
600.08 |
81.98 |
|
3.4 |
Fisheries |
559.00 |
83.53 |
359.84 |
64.37 |
|
3.5 |
Agri-Marketing |
1,774.00 |
266.96 |
1,534.68 |
86.51 |
4 |
Project Management |
3,560.00 |
549.67 |
3,420.01 |
96.07 |
|
Grand Total |
43,200.00 |
10,539.34 |
39,898.18 |
92.36 |
New Initiatives under OCTMP
1. Account Support Organisation (ASO)
Account Support Organisation (ASO) is the Chartered Account firm engaged at Pani Panchayat (PP) Level for handholding support to PPs. It will facilitate in writing the cash book, reconciling passbook with cash book & maintaining all types of financial records. The ASO will send monthly financial progress/ status report to District Project Unit (DPU). The objective of this is to strengthen the capacity of PP on maintaining books and record so that they can continue the practice in the post project period.
2. Adoption of Mother-Child account
OCTMP has adopted Single Bank account procedure which is known as Mother-Child Account. All the funds are being deposited at state account (Mother), while district level accounts (Child) have been opened with zero balance. The DPU will issue cheques as per the allocation from the Child account which would can be monitored from the Mother account. The entire procedure is being done through the MIS.
3. Multi-Disciplinary staff
As per the Project Development Objective (PDO), a multi-disciplinary professional (Technical, Social & Livelihood) working in a team at the State, District and Cluster level.
4. 7-days training programme has been organized at the Centre of Excellency, IIT, Roorkee for capacity building of Minor Irrigation Engineers.
5. Tank level trainings and hand holding support have enabled in creation of critical mass at Pani Panchayat level leading to meet the larger demand for services & solidarity among farmers.
6. In order to ensure that the Pani Panchayat will take full responsibility for Operation and Maintenance of the tank system, a manual has been developed by the project which is known as "Taking over Manual". This manual would be used by the Pani Panchayat members as a guide for successful take over and operate & maintain the tank systems.
7.Self-Reliant Pani Panchayats
The concept of "Self Reliant Pani Panchayats - A Vision" has been developed by OCTMP for building up the Pani Panchayats in the following field
- Knowledge & Skill (O & M, Crop- Water Management)
- Entrepreneurial Vision & Skills
- Collective Actions
- Self-Governance (Conflict Resolution, Transparency)
- Financial Management
Procurement & Audit
The World Bank procurement procedure is being adopted in OCTMP. For effective audit, the project has engaged Internal and External Auditors (Chartered Account consultancy Farm).
Reporting Methods
For effective reporting and monitoring of activities, the project has a Monitoring & Evaluation unit at State level in the State Project Unit (SPU) & DPU level. Here Pani Panchayat (PP) is the grass root organisation which maintains different records for keeping the data at tank level. Each Pani Panchayat is supported by at least one Community Resource Person (CRP). The CRP facilitates the PP for maintaining records and provides information to the Cluster & DPU team as and when required. The DPU MLE-MIS officer submits MPR & QPR as per the prescribed formats to SPU. Besides, the project has a web based MIS, which is being updated at DPU and SPU level.
OUTCOME OF PROJECT DEVELOPMENT OBJECTIVES |
A. PDO Indicator (s) |
Indicator |
Baseline Value |
Original Target |
Formally Revised Target |
Actual Value Achieved at Completion |
Date achieved |
01-07-2008 |
01-07-2012 |
30-06-2016 |
01-08-2016 |
Indicator-1 |
Percentage increase in crop productivity (measured in % increase) |
Value (Quantitative or Qualitative) |
Paddy:
2.88 t/ha |
Paddy:
25% Increase |
Paddy:
25% Increase |
Paddy: |
42 % Increase with existing Technology & 83% increase with new technology |
Green gram: 0.40 t/ha |
Green gram: 30% Increase |
Green gram:
30% Increase |
Green gram: |
57 % Increase with existing Technology & 95 % increase with new technology |
Mustard:
0.45 t/ha |
Mustard: 30% Increase |
Mustard:
30% Increase |
Mustard: |
150 % Increase with existing Technology & 200 % increase with new technology |
Groundnut: 1.25 t/ha |
Groundnut: 20% Increase |
Groundnut:
20% Increase |
Groundnut: |
Achieved |
Vegetables: 10.0 t/ha |
Vegetables: 50% Increase |
Vegetables:
50% Increase |
Vegetables: |
Achieved |
Indicator |
Baseline Value |
Original Target |
Formally Revised Target |
Actual Value Achieved at Completion |
Indicator-2 |
Percentage increase in cropping intensity (measured in % increase) |
Value (Quantitative or Qualitative) |
125% |
20% Increase |
20% Increase |
15% Increase |
Indicator-3 |
Percentage increase in Fish Productivity (measured in % increase) |
Value (Quantitative or Qualitative) |
0.03 t/ha |
400 % Increase |
400 % Increase |
883 % Increase |
Indicator-4 |
Percentage of Water users in rehabilitated tank systems satisfied with WUA operations and maintenance. |
Value (Quantitative or Qualitative) |
0% |
75.0% |
85.0% |
71.50% |
Indicator-5 |
Percentage of WUAs in rehabilitated tank systems whose O&M expenditure is as per annual O&M plan |
Value (Quantitative or Qualitative) |
0% |
80.0% |
85.0% |
54.00% |
B. Intermediate Outcome Indicator (s)
Indicator |
Baseline Value |
Original Target |
Formally Revised Target |
Actual Value Achieved at Completion |
Indicator-1 |
WUAs holding general body meeting (Measured in %) |
Value (Quantitative or Qualitative) |
0% |
80% |
80.0% |
92.0% |
Indicator-2 |
WUAs maintaining appropriate cash books and water regulation registers
(Measured in %) |
Value (Quantitative or Qualitative) |
0% |
80% |
85.0% |
99.3% |
Indicator-3 |
Total current –year assessed water charge collected (Measured in %) |
Value (Quantitative or Qualitative) |
0% |
90% |
95.0% |
0.0% |
Indicator-4 |
Minor Irrigation Department deemed able to implement, monitor and evaluate minor investments (Measured through qualitative assessment) |
Value (Quantitative or Qualitative) |
Weak |
N.A |
Able |
Able |
Indicator |
Baseline Value |
Original Target |
Formally Revised Target |
Actual Value Achieved at Completion |
Indicator-5 |
Tank command area irrigated (under normal rainfall conditions) (Measured in %) |
Value (Quantitative or Qualitative) |
54%
(64,800 ha) |
90%
(1,08,000 Ha) |
90.0%
(57,813 ha) |
123.0%
(79,162 ha) |
Indicator-6 |
Middle reach and tail end farmers reporting improved water availability in rehabilitated tanks (Measured in % increase) |
Value (Quantitative or Qualitative) |
0% |
75% |
75% |
94.0% |
Indicator-7 |
Increase in value of crop output per unit of water in command area of rehabilitated tanks (Measured in % increase) |
Value (Quantitative or Qualitative) |
0% |
15% |
20% |
11.0% |
Indicator-8 |
Tanks with social and environment action plans prepared and implemented
(Measured in %) |
Value (Quantitative or Qualitative) |
0% |
100% |
100% |
100.0% |
Indicator-9 |
Farmers in project area adopting improved production techniques (measured in %) |
Value (Quantitative or Qualitative) |
10% |
40% |
45% |
47.8% |
Indicator-10 |
Tank fishing communities in project area adopting improved production/ harvesting techniques (Measured in %) |
Value (Quantitative or Qualitative) |
0% |
40% |
45% |
84.0% |
Indicator-11 |
Increase in number of improved breed cattle in project area (Measured in units) |
Value (Quantitative or Qualitative) |
0 |
12,000 |
7,000 |
2,470 |
Indicator-12 |
Increase in share of final sale value obtained by farmer marketing groups in targeted commodities (Measured in % increase) |
Value (Quantitative or Qualitative) |
0% |
10% |
15% |
15.0% |
Indicator-13 |
No. of functioning farmer marketing groups established (Measured in units) |
Value (Quantitative or Qualitative) |
0 |
500 |
250 |
225 |


